EDA and Data Wrangling
Unboxing of New Data Set
1. Unboxing of New Phone
想象刚刚到货了一个新的手机,一种可能的流程是:
开机 随便试试 发现某个设置不顺手 调整设置 重新试试 发现某个设置不顺手 调整设置 …

2. Unboxing of New Data Set
刚刚得到了一个新的数据集:
Load Data EDA 发现不对劲 Wrangling EDA 发现不对劲 Wrangling …
3. EDA (Exploratory Data Analysis) and Wrangling
It is an open-ended, informal analysis paradigm.
It majorly focuses on:
Structure
Granularity, Scope, and Temporality
Faithfulness
3.1 Data’s Structure
Format:
- CSV
- TSV
- Json
Variable Type:
- Quantitative
- Continuous
- Discrete
- Qualitative
- Ordinal
- Nominal
- Quantitative
4. Data’s Structure
4.1 File Format: csv, tsv, json …
'Year,Candidate,Party,Popular vote,Result,%\n'
'1824,Andrew Jackson,Democratic-Republican,151271,loss,57.21012204\n'
'\ufeffYear\tCandidate\tParty\tPopular vote\tResult\t%\n'
'1824\tAndrew Jackson\tDemocratic-Republican\t151271\tloss\t57.21012204\n'[
{
"Candidate": "Andrew Jackson",
"Party": "Democratic-Republican",
"Popular vote": 151271,
},
]4.2 Metadata
[
  {
    "Meta": {
      "Size": "1.2MB",
      "Date": "2021-10-01",
    },
    "Data": [
      {
        "Candidate": "Andrew Jackson",
        "Popular vote": 151271,
      }, // ... more data section
    ]
  }
]
4.3 Variable Type

5. Data’s Granularity, Scope, and Temporality
Granularity: How detialed is the data about an indivisual?
Scope: How well the samples cover the target population?
Temporality: How timely is the data?
6. Data’s Faithfulness
6.1 Signs that data may not be faithful
- Unrealistic or “incorrect” values
- Violations of obvious dependencies
- Clear signs that data was entered by hand
- Signs of data falsification
- Duplicated
- Truncated data
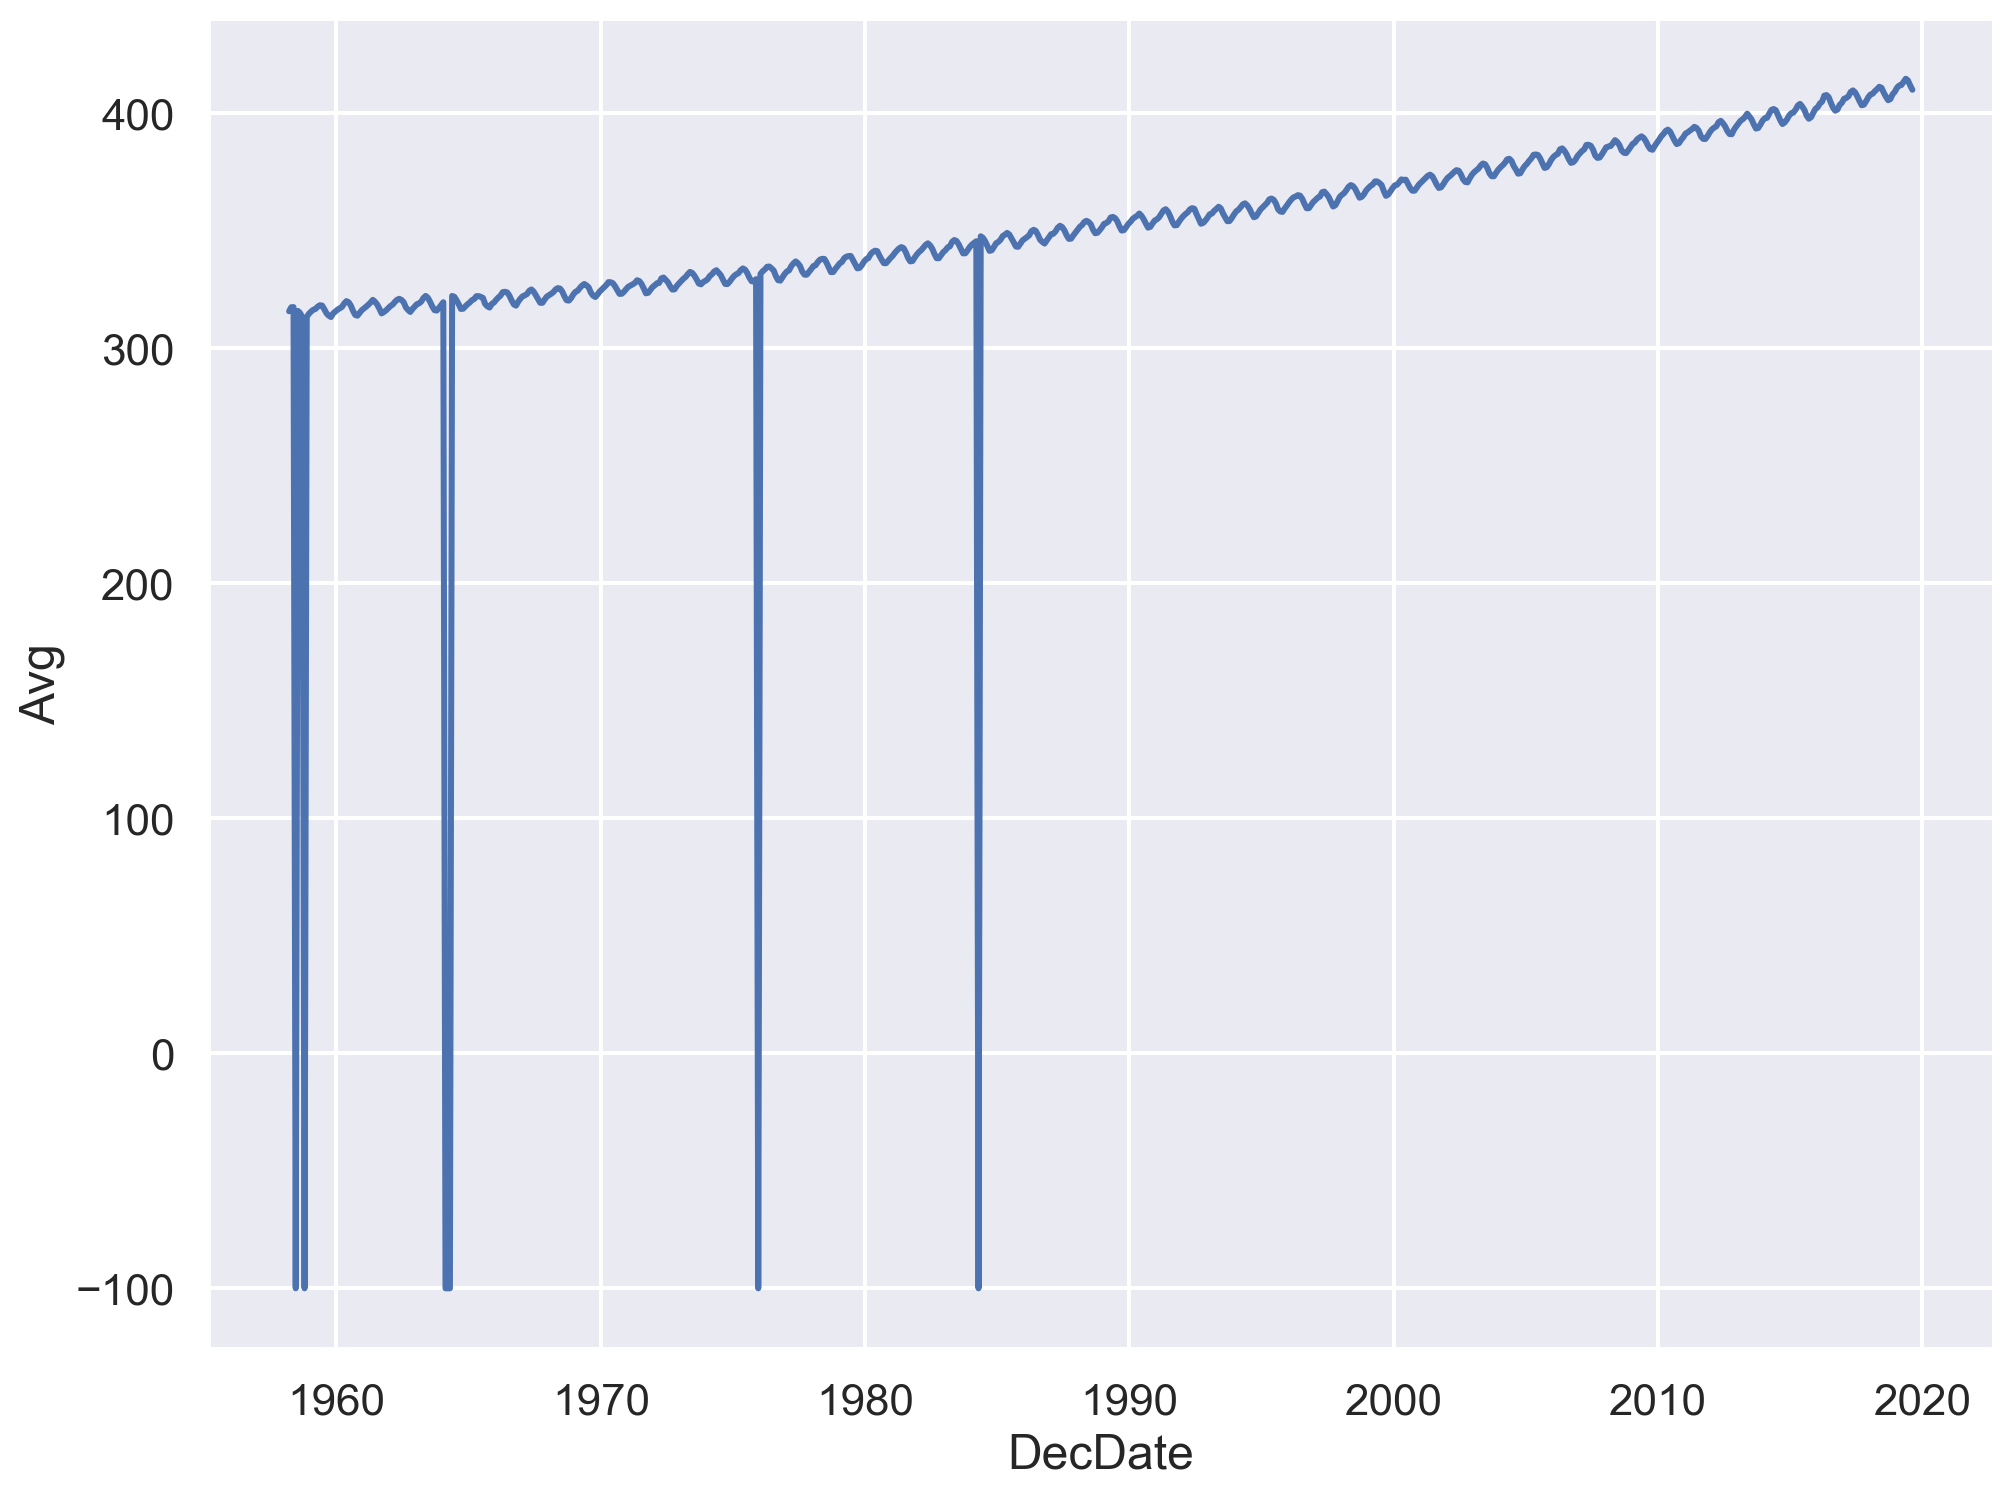
6.2 Missing Values (Abnormal Values)
- Many abnormal values are actually just missing values.

6.2 Missing Values (Abnormal Values)
Three typical ways to deal with missing values: Drop, NaN, and Impute.

7. Summary
Data Overview: Assess data’s date, size, organization, and structure.
Individual Analysis: Investigate each field/attribute/dimension.
Pairwise Analysis: Explore relationships between dimensions.
Along the way, we can:
- Visualize
- Validate assumptions
- Address anomalies
- Document everything (Ideally using Jupyter Notebook)
