DATA100 Note [2]

转写自组会上讲解使用的 Slides,高度凝练了 DATA100 中 Pandas 的教学内容。

1. Pandas 简介

  • 什么是 Pandas ?

    • 一个开源的数据分析和处理 Python 库,基于 NumPy。
    • Like a Python module version of SQL
  • 为什么 Pandas ?

    • 提供了快速、灵活和表达式丰富的数据结构,使 “关系” 和 “标签” 数据的处理既简单又直观。
    • Highly compatible wito NumPy
    • Popular

2. Pandas 使用的基础数据结构

  • Pandas 处理的基本数据类型:Tabular Data

  • 基本数据结构

    • Series:1D tagged data structure,类似于 Python 中的 dict

    • DataFrame:2D tagged data structure,以 Series 为列构成的 2D table 。

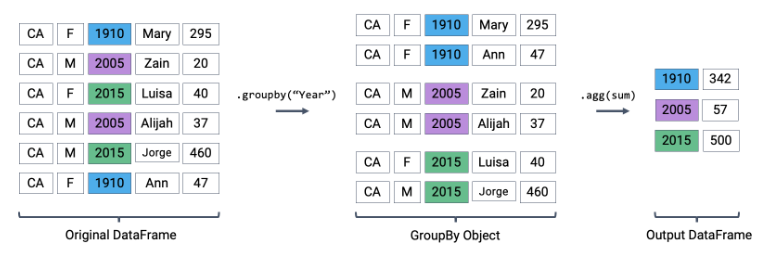
    • DataFrameGroupByDataFrame.groupby 的产物,是多组有共同特征的 DataFrames 集合。

3. 数据处理的基本操作

  1. Read Data:

    • Create a DataFrame from a file or from a Python object.
  2. Select Data:

    • Select rows, columns, or cells from a DataFrame.
  3. Filter Data:

    • Define conditions, generate boolean masks, and filter data.
  4. Sort Data:

    • Sort data by the index we specify.
  5. Aggregating Data:

    • Group data by some criteria and apply functions to the groups.
  6. Join Data:

    • Combine DataFrames based the key columns we specify.
  7. Modify Data

  8. Delete Data

3.1 Read Data

From csv file or dict, list, tuple, ndarray, Series objects in Python.

1
2
3
4
5
6
7
8
9
10
11
12
13
14
import pandas as pd

# Read from csv file
df = pd.read_csv('data.csv')

# Create DataFrame from Python objects
df_dict = pd.DataFrame({'Name': ['Tom', 'Jerry'], 'Age': [20, 21]})
df_list = pd.DataFrame([['Tom', 20], ['Jerry', 21]], columns=['Name', 'Age'])
df_tuple = pd.DataFrame((('Tom', 20), ('Jerry', 21)), columns=['Name', 'Age'])

import numpy as np # ndarray example
data = np.array([['Tom', 20], ['Jerry', 21]])
df_ndarray = pd.DataFrame(data, columns=['Name', 'Age'])

3.2 Select Data

  • Select Columns: Use column names directly or df[['col1', 'col2']].

  • Select Rows: Use slicing or conditions, e.g., df[1:3] or df[df['Age'] > 20].

  • Select Cells: Combine row and column selection, e.g., df.loc[rows, cols] or df.iloc[row_indices, col_indices].

3.2 Select Data

1
2
3
4
5
6
7
8
9
10
11
12
13
14
# Select a single column
names = df['Name']

# Select multiple columns
subset = df[['Name', 'Age']]

# Select rows by slicing
rows_slice = df[0:2]

# Select rows by condition
adults = df[df['Age'] >= 18]

# Select specific cells
cell_value = df.loc[1, 'Name'] # Second row, Name column

3.3 Filter Data

1
2
3
4
5
6
7
8
9
10
11
# Simple condition
adults = df[df['Age'] >= 18]

# Multiple conditions
young_adults = df[(df['Age'] >= 18) & (df['Age'] <= 30)]

# Using query method
seniors = df.query('Age > 60')

# Filtering with isin method for categorical data
students = df[df['Occupation'].isin(['Student'])]

3.4 Sort Data

Sorting data is crucial for analyzing datasets where the order of rows is significant.

1
2
3
4
5
6
7
8
# Sort DataFrame by a single column
df_sorted = df.sort_values(by='Age')

# Sort DataFrame by multiple columns
df_sorted_multi = df.sort_values(by=['LastName', 'FirstName'])

# Sort in descending order
df_sorted_desc = df.sort_values(by='Age', ascending=False)

3.5 Aggregating Data

GroupingApplying FunctionAggregatedGrouping \to Applying\ Function \to Aggregated

aggregation

3.5.1 Aggregating Data

Aggregating data involves combining multiple pieces of data into a summary form.

1
2
3
4
5
6
7
8
# Group by a single column and calculate mean
grouped_single = df.groupby('Department').mean()

# Group by multiple columns
grouped_multi = df.groupby(['Department', 'Position']).sum()

# Applying multiple aggregation functions at once
grouped_agg = df.groupby('Department').agg({'Salary': ['mean', 'min', 'max']})

3.5.2 Aggregating Data with Pivot Tables
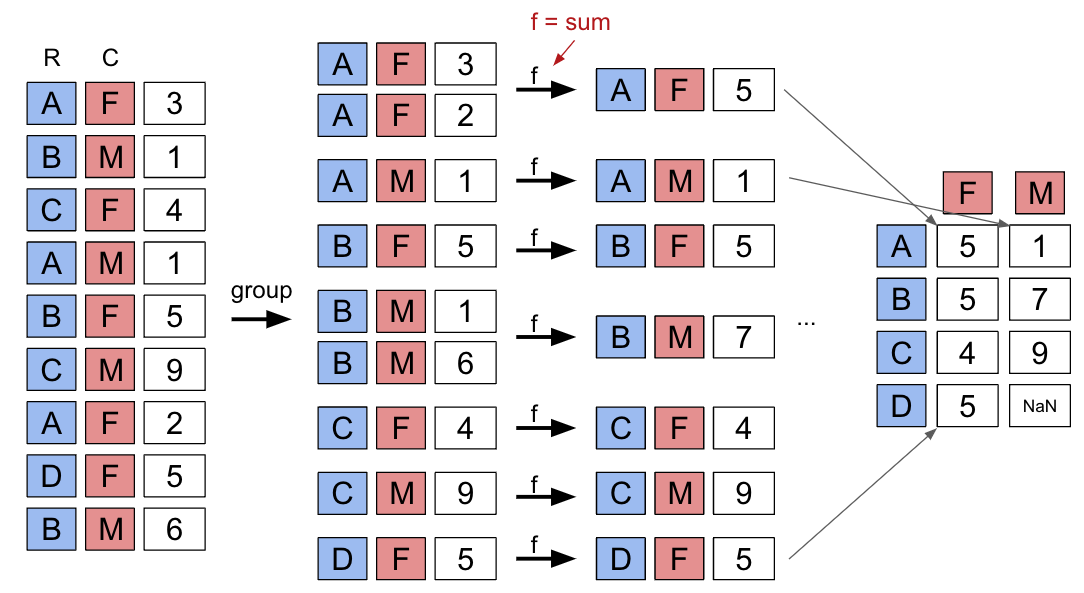
pivot

3.5.2 Aggregating Data with Pivot Tables

1
2
3
4
5
6
7
8
9
# The `pivot_table` method is used to generate a Pandas pivot table
import numpy as np

babynames.pivot_table(
index = "Year",
columns = "Sex",
values = "Count",
aggfunc = np.sum,
)

3.6 Join Data

  • left and right parameters are used to specify the DataFrames to be joined.
  • left_on and right_on parameters are for aligning the key columns.
1
2
3
4
5
6
7
8
9
10
# Merge two DataFrames on a key
merged_df = pd.merge(df1, df2, on='EmployeeID')

# Merge using different keys for each DataFrame
merged_diff_keys = pd.merge(
df1,
df2,
left_on='EmployeeID_df1',
right_on='EmployeeID_df2'
)

3.7 Modify Data

1
2
3
4
5
6
7
8
9
10
11
# Change a value directly
df.loc[0, 'Age'] = 22

# Add a new column
df['Country'] = 'Unknown' # Adds a new column with all values set to 'Unknown'

# Apply a function to transform data
df['Age in 5 Years'] = df['Age'] + 5

# Using apply() to apply a custom function to each row
df['Name Length'] = df['Name'].apply(len)

3.8 Delete Data

1
2
3
4
5
6
7
8
9
10
11
12
# Drop a column
df.drop('Age in 5 Years', axis=1, inplace=True)

# Drop a row
df.drop(index=0, inplace=True)

# Drop rows based on condition
df = df[df['Age'] >= 18]

# Set a cell value to NaN
import numpy as np
df.loc[df['Age'] < 18, 'Age'] = np.nan